The Stock market is in a classic uptrend from the capitulation low.
|
Showing posts with label chart. Show all posts
Showing posts with label chart. Show all posts
Thursday, April 9, 2009
Stocks the Nervous Norvis Market (Chart and View)

Saturday, April 4, 2009
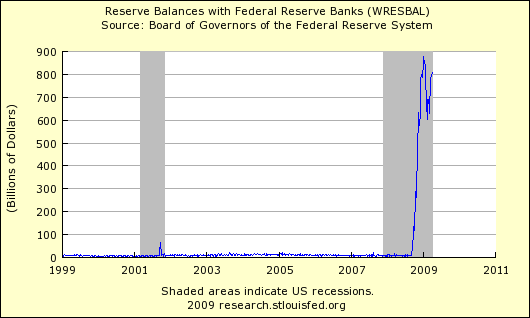
The Fed Balance Sheet -- Reserve Balances Outstanding (Graph)
Federal Reserve Chairman Ben Bernanke discusses the impact of the Fed Balance sheet and the task of unwinding when the economy begins to recover, or if inflation begins to rise.
It should be obvious from the chart that this will be a daunting task. I guess you could believe in miracles. My guess is that the best strategy is to get a healthy investment in stocks that will benefit from rising inflation .
Follow All American Investor on Twitter
It should be obvious from the chart that this will be a daunting task. I guess you could believe in miracles. My guess is that the best strategy is to get a healthy investment in stocks that will benefit from rising inflation .
The large volume of reserve balances outstanding must be monitored carefully, as--if not carefully managed--they could complicate the Fed's task of raising short-term interest rates when the economy begins to recover or if inflation expectations were to begin to move higher. We have a number of tools we can use to reduce bank reserves or increase short-term interest rates when that becomes necessary.
- First, many of our lending programs extend credit primarily on a short-term basis and thus could be wound down relatively quickly. In addition, since the lending rates in these programs are typically set above the rates that prevail in normal market conditions, borrower demand for these facilities should wane as conditions improve.
- Second, the Federal Reserve can conduct reverse repurchase agreements against its long-term securities holdings to drain bank reserves or, if necessary, it could choose to sell some of its securities. Of course, for any given level of the federal funds rate, an unwinding of lending facilities or a sale of securities would constitute a de facto tightening of policy, and so would have to be carefully considered in that light by the FOMC.
- Third, some reserves can be soaked up by the Treasury's Supplementary Financing Program. Fourth, in October of last year, the Federal Reserve received long-sought authority to pay interest on the reserve balances of depository institutions. Raising the interest rate paid on reserves will encourage depository institutions to hold reserves with the Fed, rather than lending them into the federal funds market at a rate below the rate paid on reserves. Thus, the interest rate paid on reserves will tend to set a floor on the federal funds rate.
Subscribe to All American Investor via Email
 Bob DeMarco is a citizen journalist and twenty year Wall Street veteran. Bob has written more than 500 articles with more than 11,000 links to his work on the Internet. Content from All American Investor has been syndicated on Reuters, the Wall Street Journal, Fox News, Pluck, Blog Critics, and a growing list of newspaper websites. Bob is actively seeking syndication and writing assignments. Bob DeMarco is a citizen journalist and twenty year Wall Street veteran. Bob has written more than 500 articles with more than 11,000 links to his work on the Internet. Content from All American Investor has been syndicated on Reuters, the Wall Street Journal, Fox News, Pluck, Blog Critics, and a growing list of newspaper websites. Bob is actively seeking syndication and writing assignments. |
Follow All American Investor on Twitter
Wednesday, March 11, 2009
S and P 500 Trend...Two Days Up...Then...

It is not unusual for a severely down sloped market to see a sharp two day contra trend rally. We are seeing that in the S and P 500 right now.
Savvy short term traders should look to sell any rally into the 740-750 range on Wednesday night or Thursday.
The inside day after the bottom, followed by a hook up does warrant some caution. It is possible that we could see an extension of the rally after a short pop down. The more significant resistance in this down trend is up near 800.
The down trend remains intact.
Sunday, March 1, 2009

Subscribe to:
Posts (Atom)