Monday, March 30, 2009

GoldCorp (GG) Twelve Times Your Money in Ten Years (Chart)

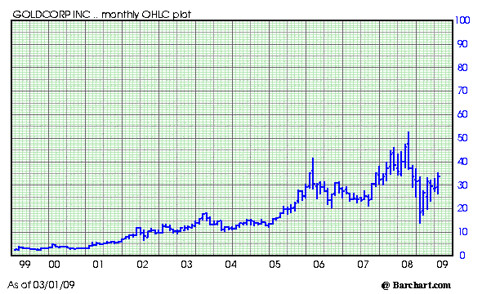
Gold Corp (GG), Ten Year Chart, Monthly (not dividend adjusted).

Goldcorp 10 Year 328


You don't hear much about Gold Corp (GG). The gold stock has risen from the $2.50 area in 1999 to a high of $52.65 during July, 2008 (prices are adjusted for stock splits).

The stock closed Friday at $33.76. GoldCorp dropped to a low in the $14.00 area in October, 2008 and is now moving up again.

If you had invested $10,000 in GoldCorp in 1999, it would now be worth more than $125,000. This does not include adjustments for dividends. 12.5 times your money in ten years, not bad.
Subscribe to All American Investor via Email


Bob DeMarco is a citizen journalist and twenty year Wall Street veteran. Bob has written more than 500 articles with more than 11,000 links to his work on the Internet. Content from All American Investor has been syndicated on Reuters, the Wall Street Journal, Fox News, Pluck, Blog Critics, and a growing list of newspaper websites. Bob is actively seeking syndication and writing assignments.


Follow All American Investor on Twitter

More from All American Investor


Wednesday, March 25, 2009

Facing Alzheimer's: A Personal Story

Tonight on ABC News "Nightline": Facing Alzheimer's: A Personal Story

Airing tonight on ABC News "Nightline", Terry Moran takes a powerful and intimate look at facing the risks of Alzheimer's. “Nightline" airs at 11:35 p.m. (ET/PT) weeknights on the ABC Television Network (check local listings). The program is anchored by Cynthia McFadden, Terry Moran, and Martin Bashir. John Donvan and Vicki Mabrey are correspondents. James Goldston is the executive producer.

Also see:

Nightline: Why I Got My DNA Tested for Alzheimer's Disease

Tuesday, March 17, 2009

S an P 500 Chart Market Consolidation March 17

The blue and red lines are starting to come together indicating a consolidation of the recent down trend. The thing to watch here is the green line. It is currently sloped down. As long as it remains sloped down the market is still vulnerable to the downside on a short term basis.

It should be obvious that hard resistance is up near 800, and hard support is down near 666.

We used the June S and P 500 futures chart this time around.
clipped from charts.barchart.com
Chart for S&P 500 INDEX June 2009
 blog it

Wednesday, March 11, 2009

S and P 500 Trend...Two Days Up...Then...


It is not unusual for a severely down sloped market to see a sharp two day contra trend rally. We are seeing that in the S and P 500 right now.

Savvy short term traders should look to sell any rally into the 740-750 range on Wednesday night or Thursday.

The inside day after the bottom, followed by a hook up does warrant some caution. It is possible that we could see an extension of the rally after a short pop down. The more significant resistance in this down trend is up near 800.

The down trend remains intact.

Monday, March 9, 2009

S anp P support 652 and dropping March 9

We are using the S and P 500 March futures contract this morning.

Support continues to decline and is now around the 652 area. Price drops more than one percent below this level should find good support today.

There is good news as the momentum behind the downside thrust is slowing. However, the market is still subject to a potential downside market capitulation at any time. A hard downside thrust, or continued slow deterioration is likely to trigger mutual fund redemption's.

Many forecasters are calling for a low around the S and P 500, 600 level. This almost seems like a self fulfilling prophesy coming to fruition. Maybe, maybe not.
clipped from charts.barchart.com
Chart for S&P 500 INDEX March 2009
 blog it

Sunday, March 8, 2009

Ballooning FRB balance sheet could bring Inflation

Some might find this chart disturbing. The chart depicts reserve balances with the Federal Reserve Bank.

Friday, March 6, 2009

S an P Support 659 and dropping, Market Capitulation

Could we be on the edge of a market capitulation?

The S and P 500 continues to trend down with support for today in the 659 area. 659 is about 3.7 percent lower than the current S and P price as I am writing this.

A market capitulation occurs when investors surrender all hope of recouping their losses in the market--and sell in a panic.

It appears to me that we could be reaching the capitulation point. The market bears close watching today. A close around or below the 659 area would not bode well for the opening on Monday morning. On the other hand, a market capitulation is one of the few times where you can make real money in the market quickly.
clipped from charts.barchart.com
Chart for S&P 500
 blog it

Thursday, March 5, 2009

Is it time to buy Yamana Gold

Yamana gold is well known by institutional investors and Jim Cramer. The company has a market cap around $6 Billion.

This chart looks good to me. The chart shows this stock continues to make higher highs, and higher lows. Always a good thing.

The only thing that would bother me right now is the seasonal pattern for gold. Gold tends to make its seasonal high in the February 15-March 15 period. From that point it tends to trend down into the summer. Gold tends to bottom in the August 15-October 15 period.

Gold almost almost always rises from October 15- February 15 no matter what. This is due to strong seasonal demand that comes in the form of physical buying for jewelry, and strong buying out of China and India. I intend to write about this soon.

This is not a recommendation to buy or sell. File this under food for thought. Now go do some homework.
clipped from charts.barchart.com

Chart for YAMANA GOLD INC

blog it

Wednesday, March 4, 2009

S and P 500 no longer Oversold

The S and P 500 is no longer oversold. The market should start finding support today under 685. The market does look a bit tired, so a one or two day rally would not be a surprise. By the same token, a market capitulation late this week and on Monday would not come as a surprise.

Coming up tonight. How to prepare and score big during a market capitulation
clipped from charts.barchart.com

Chart for S&P 500
 blog it

Tuesday, March 3, 2009

S an P Two Standard Deviations Below the Line

If you look at the blue line on the S and P futures chart you will notice the line is sloping down and the market is hugging it on the way down. If you click the link and look at the bigger version of the chart you will notice that every time the market trades well below the line it snaps back up.

The line represents two standard deviations below the mean. This is a very good indication of when the market is oversold intraday.

It seems that every time the market bounces up off the line the TV talking heads start discussing a market bottom. Not yet.

For more than two weeks we have been forecasting this hard drop in the market based on this formation. The market is in a downside range expansion.

Expect some serious volatility and wide trading ranges. It is almost over though, so be careful.

Hard dips below the line should find good support today.
clipped from charts.barchart.com
Chart for S&P 500 INDEX March 2009
 blog it

Jim Cramer is a Crybaby

On Mad Money yesterday Jim Cramer cried like a baby--like the little boy that cried wolf.
This is the same Jim Cramer that was nutsy bullish when stocks were above 1300 and getting ready to crash.

All American Investor: Jim Cramer is a Crybaby

Monday, March 2, 2009

A Tale of Two Stocks Intel and Apple

clipped from charts.barchart.com
Chart for INTEL CORPORATION
clipped from charts.barchart.com
Chart for APPLE INC.
 blog it

Buffett admits sucking his thumb

All American Investor: Buffett admits sucking his thumb

During 2008 I did some dumb things in investments. I made at least one major mistake of commission and several lesser ones that also hurt. I will tell you more about these later. Furthermore, I made some errors of omission, sucking my thumb when new facts came in that should have caused me to re-examine my thinking and promptly take action.

Sunday, March 1, 2009

Gold Chart

London PM Fix, Quoted in Dollars
 blog it